RR Phantom

Location : Wasted Space
Job/hobbies : Cayman Islands Actuary
 |  Subject: Excess Deaths versus Percent Vaccinated: A comparison of the timing of excess deaths and population vaccination percentages by age Subject: Excess Deaths versus Percent Vaccinated: A comparison of the timing of excess deaths and population vaccination percentages by age  Mon Mar 21, 2022 5:14 pm Mon Mar 21, 2022 5:14 pm | |
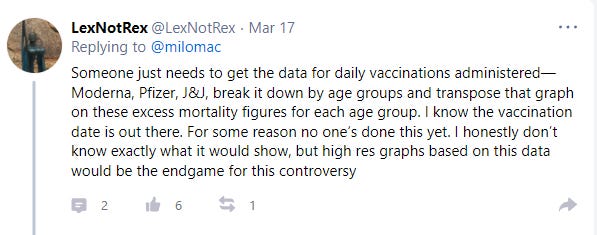
| The other day, LexNotRex on GETTR made the following comment on one of my posts.

I had been thinking about that as well and it was on my list of things to do.
So here it goes.
Data
The data sets I use are both from the CDC. Every chart in this post can be created using the following two data sets.
The excess mortality charts to which LexNotRex is referring are the ones created by Ed Dowd and the first data set used in this analysis is the same set I used to reproduce the Dowd charts in this post.
AH Excess Deaths by Sex, Age, and Race and Hispanic Origin.
The second is the vaccination data found here:
COVID-19 Vaccination and Case Trends by Age Group, United States
A couple of notes on the data:
The Excess Death data set is from February 23, which means it was created before the CDC remapped COVID deaths to non-COVID deaths on March 15. See here. That’s Ok for now since we are more concerned with total excess deaths rather than looking at them by COVID and Non-COVID.
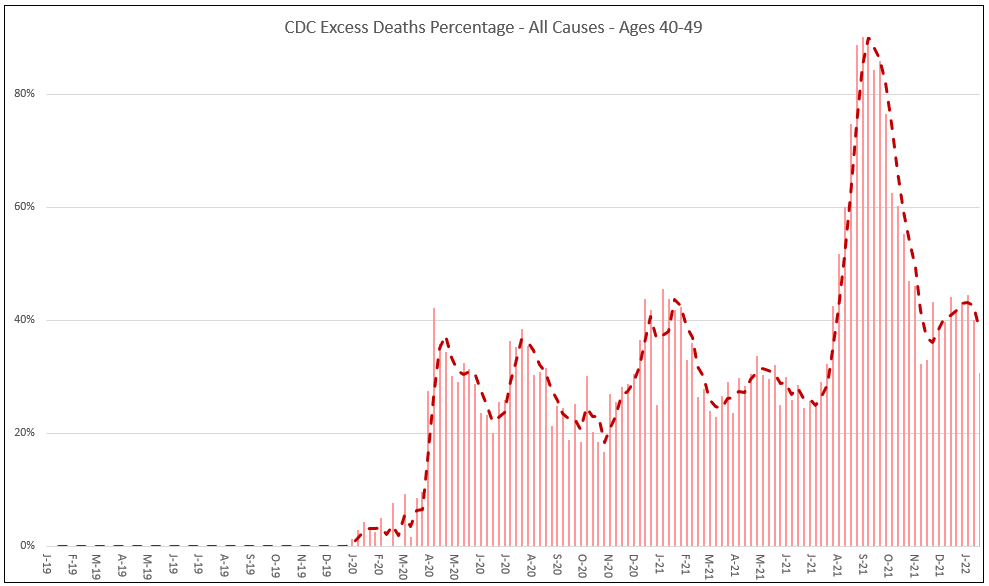
The vaccination data breaks the data down by different age categories than the original Dowd charts so we will have to create of version of the excess death percentage chart that aligns with the vaccination data. The first age group we are going to look at is 40-49.
Graphing the Results
Let’s get grounded. I will start with a version of the excess death percentage chart for ages 40-49. This can be calculated straight from the first data set listed above.

.https://milomac.substack.com/p/excess-deaths-versus-percent-vaccinated?s=r
 |
|

