RR Phantom

Location : Wasted Space
Job/hobbies : Cayman Islands Actuary
 |  Subject: Excess Death Percentage -- Reproducing Edward Dowd’s Excess Death Percentage charts from public CDC source data. Subject: Excess Death Percentage -- Reproducing Edward Dowd’s Excess Death Percentage charts from public CDC source data.  Mon Mar 14, 2022 5:31 pm Mon Mar 14, 2022 5:31 pm | |
| A few weeks ago, Edward Dowd (https://gettr.com/user/edwarddowd) presented a data set on Steve Bannon’s WarRoom that showed excess mortality by month for various age ranges. See here:
.https://gettr.com/post/pzcxwu6969
In the interview, Ed describes the work an associate of his, an actuary, did with regards to developing the charts for each age. Through my communications with Ed on Gettr, I offered to see if I could reproduce the charts from the raw data.

Ed describes some work that needed to be done with the original data to develop baselines for each age group in order to calculate excess death percentages. Presumably, this is because the original data set had a base line in aggregate but not for specific age groups.
I began with the original data set and also created baselines for each age. Admittedly, I took a couple of short cuts with regard to expect average deaths and seasonality but I figured with the level of disruption we are seeing, it would be close enough to confirm Ed’s work.
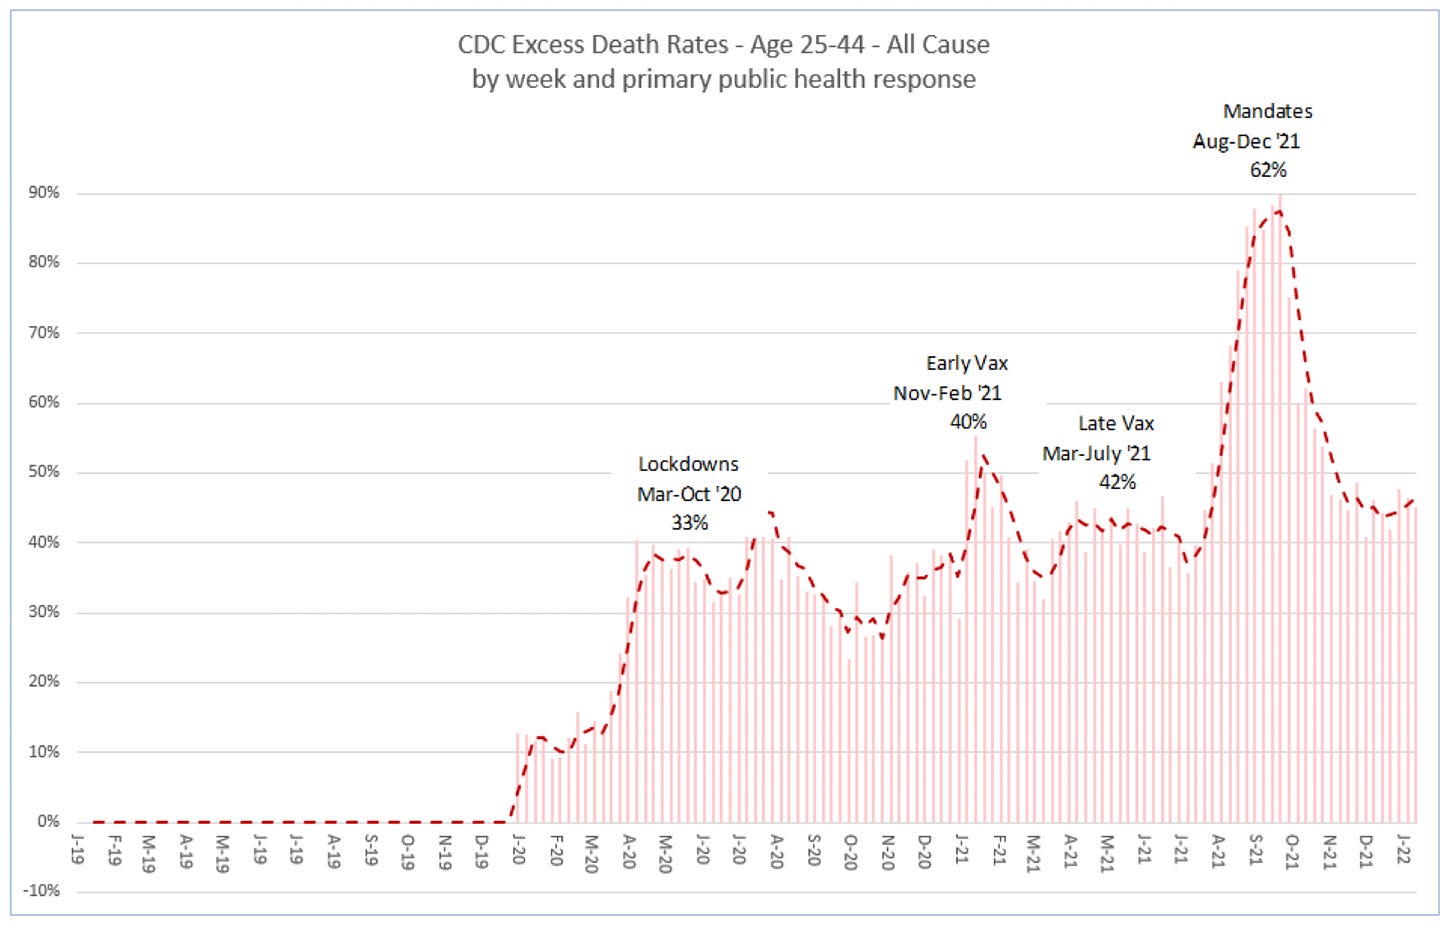
I was right. My development match Ed’s close enough to confirm it. However, while doing additional research, I came upon a CDC data set that already included baseline expected deaths by age group. Not only the age groups used by Ed, but even more granular at 5 year intervals. It also delineated by gender and ethnicity.
What this means is that I can now create versions of Ed’s charts based on CDC baselining methodologies (they confirm Ed’s - see below) but I can also dig in deeper and create comparable charts for various sub-groupings.
The data set also delineated COVID versus Non-COVID excess deaths. This is a split that was not present in Ed‘S development and, as we will see, adds a level of complexity in understanding what the data is telling us (I encourage you not to rush to judgement once you see the charts).
Before I discussed this any further, here is my development. For each age grouping, I include my aggregate chart, a chart that breaks it apart by COVID and Non-COVID and a chart that overlay’s Ed’s chart to show how they compared.
Let’s start with the Millennials.
.https://milomac.substack.com/p/excess-death-percentage?s=w
 |
|

